
table of contents
Monitoring & Observability: The DevOps Engineer’s Secret Weapon
Okay, fellow tech enthusiasts, let’s talk about something absolutely critical in the world of DevOps: monitoring and observability. In today’s complex, distributed systems, understanding what’s happening under the hood is not just a good idea – it’s an absolute necessity. As DevOps engineers, we are the architects and guardians of these intricate digital landscapes. Monitoring and observability are our essential tools, our secret weapons, for ensuring everything runs smoothly, efficiently, and resiliently. So, let’s dive in and explore how these concepts shape the day-to-day lives of DevOps engineers.
What Exactly Are Monitoring and Observability, Anyway?
Let’s start with the basics. We’ve all heard the terms “monitoring” and “observability” thrown around, but what do they actually mean? The differences, while subtle, are fundamental, and understanding them is crucial for success in DevOps.
The Core Differences: Monitoring vs. Observability
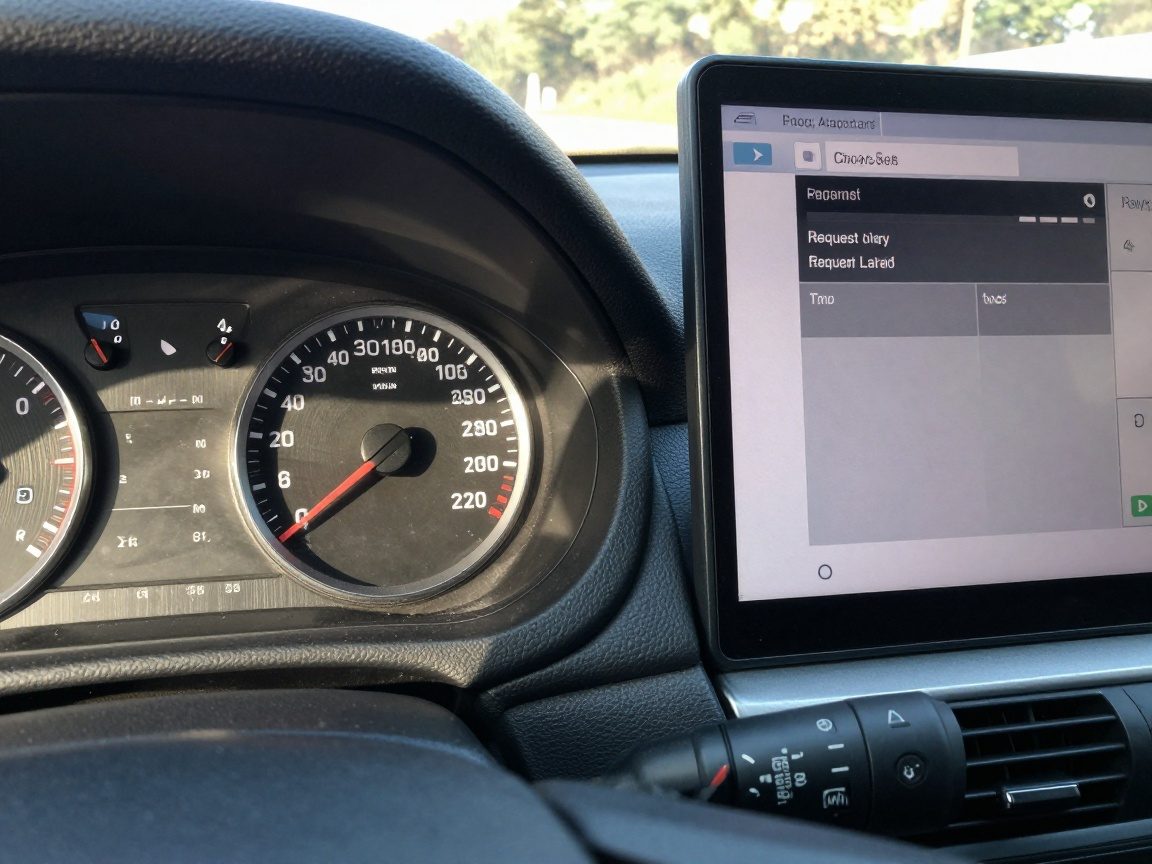
Think of monitoring as the process of checking specific pre-defined metrics and data points. It’s like having a set of gauges on your car’s dashboard – you’re looking at the speedometer, the fuel gauge, the engine temperature. Monitoring gives you a clear picture of what’s currently happening, and allows you to know if something goes wrong. If the engine temperature is too high, an alarm goes off. This gives you a clear view of the current state of the system.
Observability, on the other hand, is the ability to understand the internal state of a system by examining its external outputs. It’s like being able to diagnose what’s wrong with your car even if the dashboard gauges are malfunctioning. You rely on your senses – the smell of burning oil, the strange noises coming from the engine – to deduce the root cause of the problem. Observability provides a comprehensive understanding of your system’s inner workings. It allows you to ask, “Why did this happen?” and “What’s going on?”. It does so by providing a wider view of the metrics, logs, and traces.
In short, monitoring tells you what is happening. Observability tells you why.
Why Observability Matters in Today’s Complex Systems
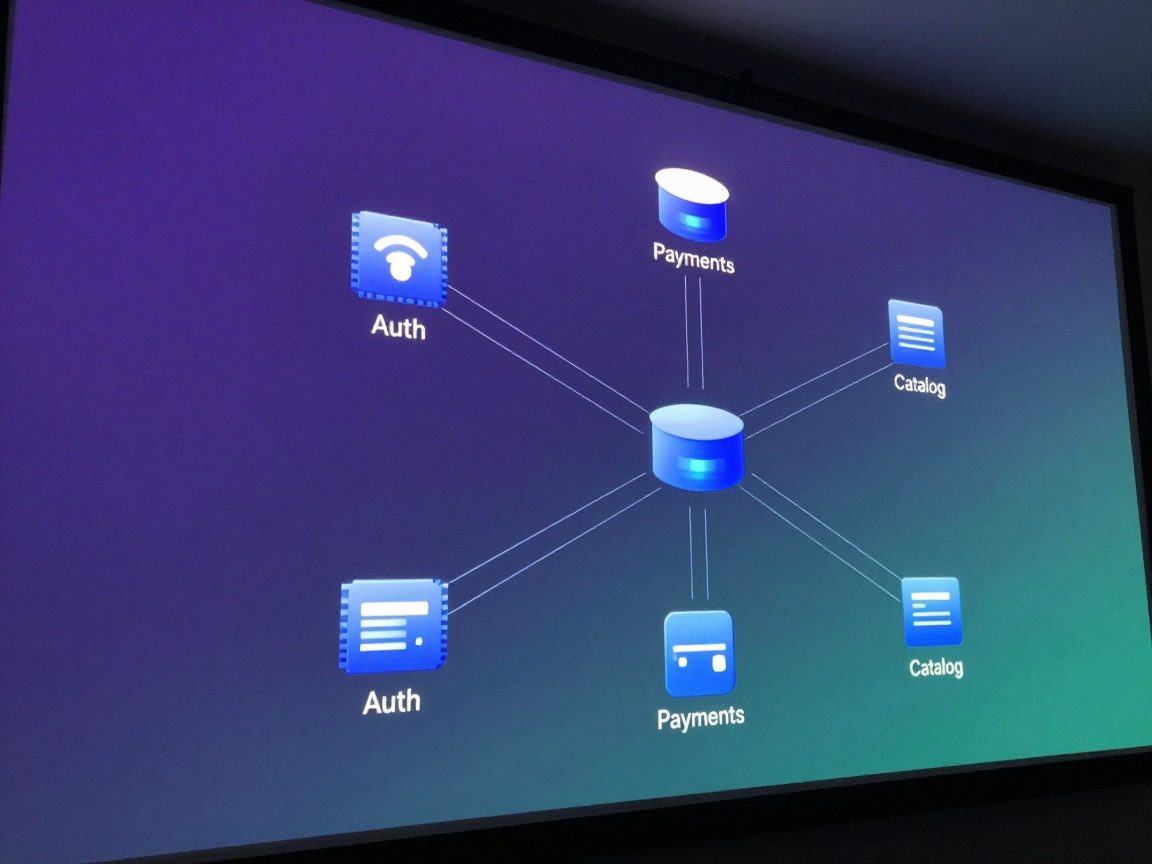
In today’s tech landscape, we’re moving away from monolithic applications and into a world of microservices, containers, and cloud-native architectures. These systems are incredibly complex, distributed, and dynamic. Traditional monitoring tools, focused on predefined metrics, often fall short. When a problem arises in this kind of environment, pinpointing the root cause can feel like searching for a needle in a haystack.
That’s where observability shines. It allows you to:
- Troubleshoot faster: By correlating logs, metrics, and traces, you can quickly identify the source of an issue.
- Understand system behavior: Observability provides a holistic view of your system’s performance and interactions.
- Improve system design: By understanding how your system behaves in production, you can make informed decisions about architecture, scaling, and optimization.
- Reduce mean time to resolution (MTTR): The faster you identify and resolve issues, the better.
The DevOps Engineer’s Role in Monitoring & Observability
So, where does the DevOps engineer fit into all this? Well, we are essentially the bridge between development and operations. We are the ones who build, deploy, and maintain the systems that drive our businesses. We own the responsibility of ensuring that these systems are observable. Our primary job is to make sure these systems are running smoothly and efficiently. This means monitoring, maintaining, and improving the system’s stability.
Bridging the Gap: DevOps and Observability
DevOps engineers are the driving force behind observability. Our responsibilities include the selection and implementation of monitoring and observability tools, defining key metrics and KPIs, setting up alerts and notifications, analyzing data, building dashboards, and establishing best practices. We work with the development team to create and test monitoring and observability systems.
We also foster a culture of observability, where everyone – from developers to operations staff – has access to the information they need to understand and improve the system. This collaborative approach ensures that we are always striving to optimize the performance of a system.
Essentially, we make sure the system is built and maintained with observability in mind, from the very beginning. By doing so, we can ensure that we can pinpoint and fix problems effectively, which translates to efficiency and cost savings.
Implementing Monitoring and Observability Tools: The Toolkit
Now, let’s get practical. To effectively monitor and observe our systems, we need the right tools. There’s a vast ecosystem of monitoring and observability solutions out there, so choosing the right ones can feel overwhelming. But with the right knowledge, the task becomes more manageable.
Popular Monitoring Tools
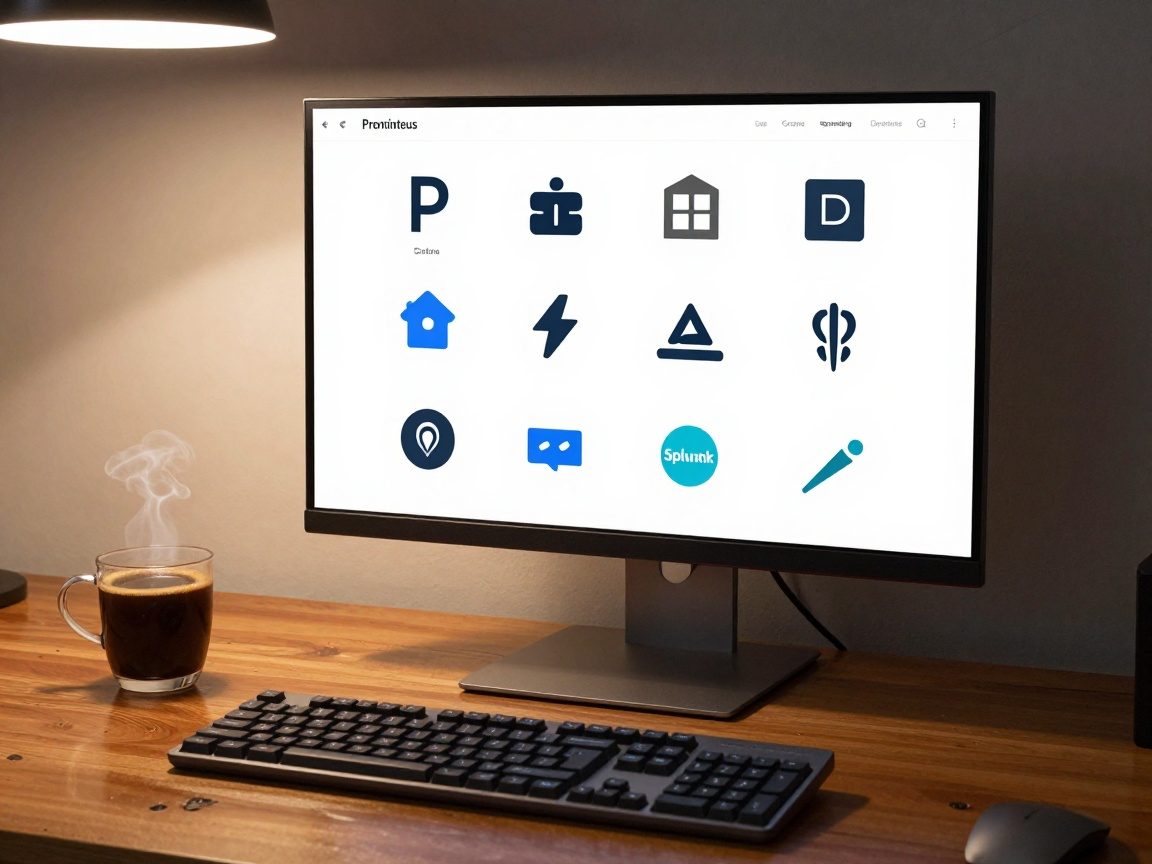
Let’s start with monitoring tools, which are the foundation of our observability strategy. Some of the most popular include:
- Nagios: A classic open-source monitoring tool known for its flexibility and vast ecosystem of plugins.
- Zabbix: Another powerful open-source solution that excels at infrastructure and application monitoring.
- Prometheus: An open-source, time-series database and monitoring system. It is particularly well-suited for cloud-native environments, especially when used with Kubernetes.
- Grafana: A data visualization and monitoring platform that is often used to create dashboards. It integrates with a wide range of data sources, including Prometheus.
These tools provide crucial insights into the health and performance of our infrastructure, applications, and services.
Key Observability Platforms
Beyond monitoring, we need tools that provide deep observability. These platforms help us understand the “why” behind the “what.” Key players in this space include:
- Datadog: A comprehensive observability platform that combines monitoring, logging, APM (Application Performance Monitoring), and security.
- Splunk: A powerful platform for searching, analyzing, and visualizing machine-generated data.
- Dynatrace: An AI-powered observability platform that automates much of the data collection and analysis process.
- New Relic: Offers application performance monitoring, infrastructure monitoring, and log management capabilities.
These platforms typically offer a combination of metrics, logs, and tracing capabilities, allowing us to gain a comprehensive view of our systems.
Conclusion: Embracing Observability for DevOps Success
Monitoring and observability are not just buzzwords; they are essential components of successful DevOps practices. By embracing these principles, you can build more resilient, efficient, and reliable systems. As DevOps engineers, we are at the forefront of this transformation. The better we are at implementing and understanding the observability data of our systems, the more capable we will be to respond to customer needs, address problems promptly, and contribute to the overall success of our organizations. By adopting these practices, we’re not just improving our systems; we’re investing in our future.
